Guide how to configure API monitoring/text analysis
Published: 2024-10-19 all articlesGuide how to configure API monitoring/text analysis
It allows defining policies on fetched content values. At start, the check validates the content type. Then, search for values in the content. After that, it checks the specified predicate on top of the values. This allows to set up site monitoring for API monitoring/text analysis, follow these steps:
-
Navigate to the site monitoring configuration page.
-
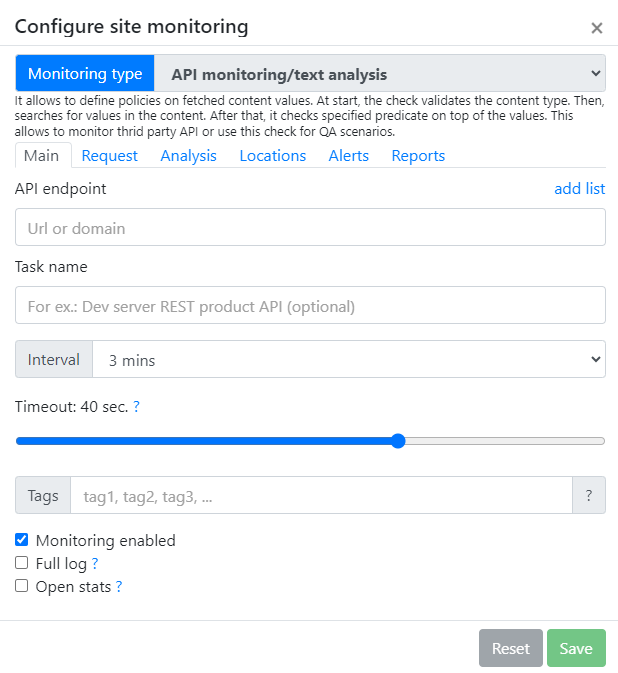
Select “API monitoring/text analysis” as the monitoring type.
-
Enter the URL/Domain/IP of the website you want to monitor in the provided field.
-
Optionally, assign a task name for easy identification.
-
Set an interval for how often the check should be performed (e.g., every 3 minutes).
-
Adjust the timeout setting according to your preference. If a response is not received within this time, an alert will be triggered.
-
Add tags if needed for categorization and faster search within your monitored sites group.
-
Enable or disable options like full log, open stats, and web users monitoring according to your requirements:
-
Full log: Allows saving every check result without grouping them.
-
Open stats: Share statistics and logs with other people, including unregistered users.
-
-
Define Policies on Fetched Content Values:
-
Specify policies based on the content values fetched from the API.
-
Validate the content type and values at the start of each check.
-
-
Configure Main Settings:
-
Adjust the following parameters for each check:
-
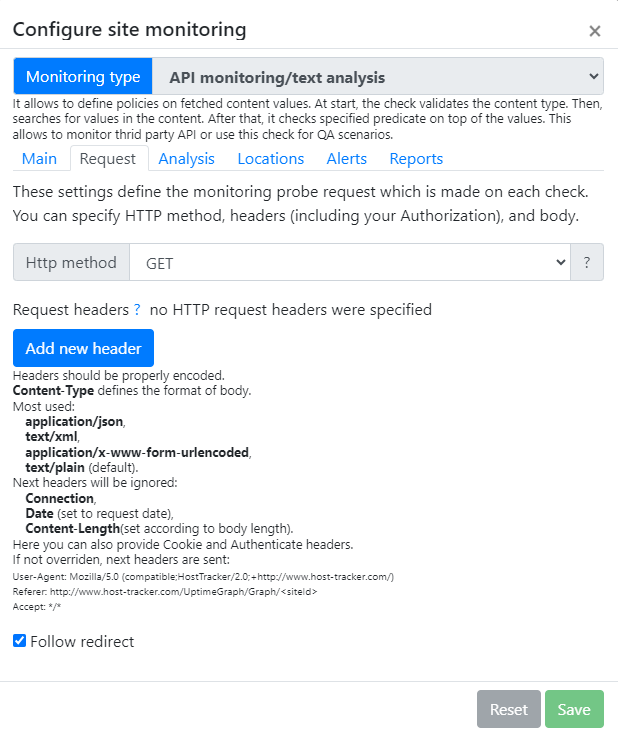
HTTP Method:
-
Choose between GET or HEAD depending on your needs.
-
GET: Simulates a page download by a real customer and collects uptime statistics.
-
HEAD: Loads only the headers of the page, useful for testing accessibility.
-
-
Request Headers:
-
Add new headers if required (e.g., Authorization).
-
Headers should be properly encoded.
-
Define the format of the request body using the Content-Type header (e.g., application/json, text/xml).
-
-
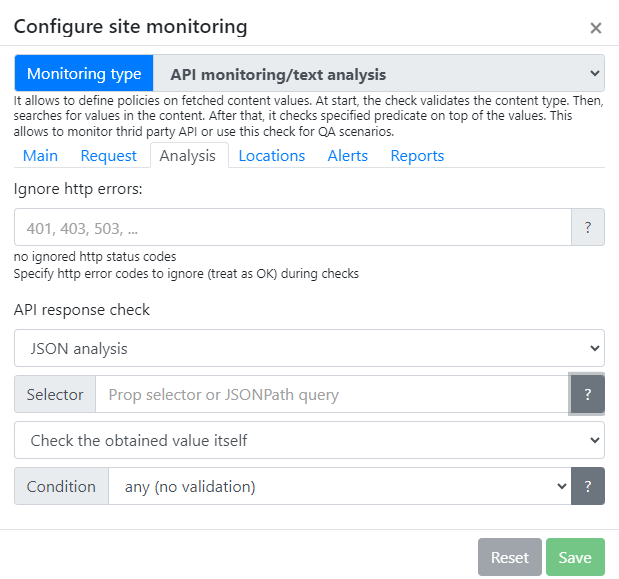
Ignore HTTP Errors:
-
Specify HTTP error codes to ignore during checks (e.g., 401, 403, 503).
-
Leave empty to treat all HTTP status codes as errors.
-
-
Follow Redirects:
-
Choose whether to follow redirects (e.g., from HTTP to HTTPS).
-
-
-
-
Save Configuration:
-
Click the “Save” button to apply your advanced monitoring settings.
-
Remember to customize these settings based on your specific API and text analysis requirements. Regularly review and optimize your configurations to ensure effective monitoring and accurate text analysis results.
-
Ignore HTTP Errors (if needed):
-
Specify HTTP error codes to ignore during checks (e.g., 401, 403, 503).
-
Leave empty to treat all HTTP status codes as errors.
-
-
API Response Check:
-
Utilize JSON analysis to evaluate the API response.
-
Use a selector or JSONPath query to extract specific data from the JSON response.
-
-
Check the Obtained Value Itself:
-
Apply numeric validation if necessary; errors will be generated if conversion fails.
-
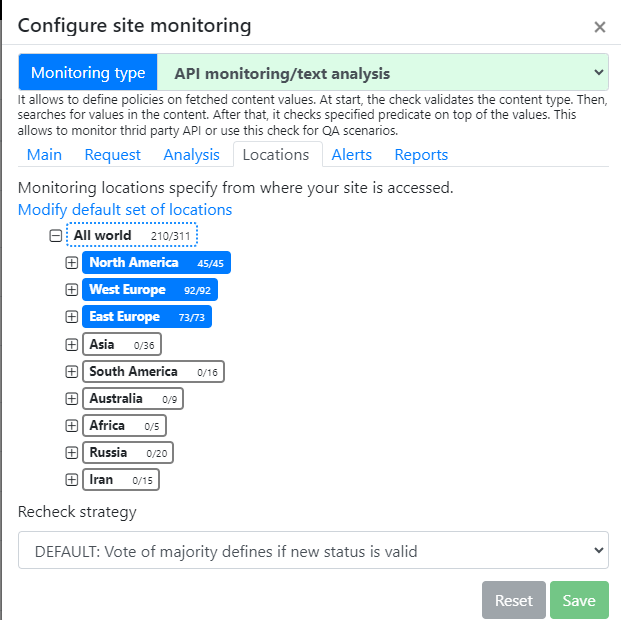
Under the “Locations” tab, choose specific regions or “All world” to monitor from various geographical locations.
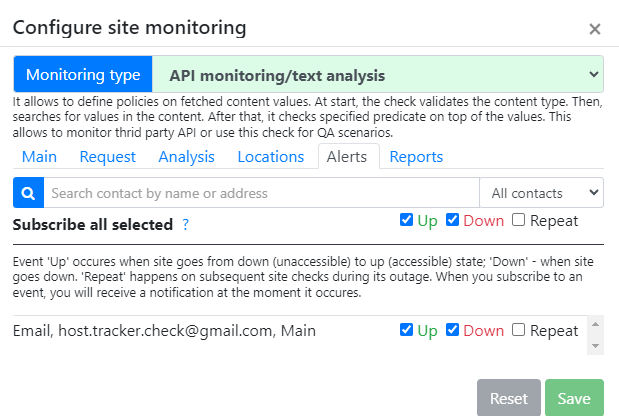
Choose Your Notification Preferences:
-
In the “Subscribe all selected” section, you’ll find three options:
-
“Up”: Select this if you want to receive notifications via email one month, 7 days, and 3 days before your domain expiration date.
-
“Down”: Choose this option to get notified when your domain name has already expired.
-
“Repeat”: Opt for this if you wish to receive daily alerts until the issue is resolved.
-
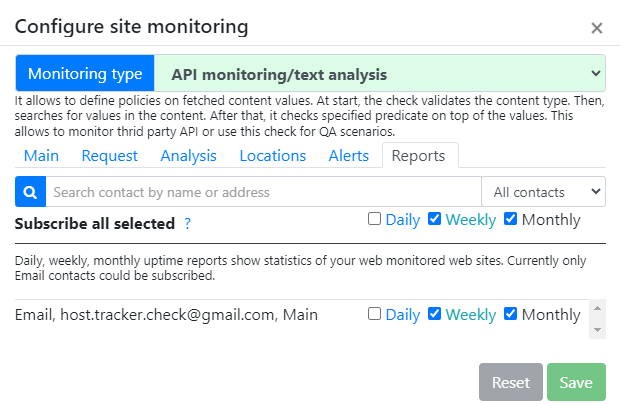
Uptime Reports:
-
Under “Subscribe all selected,” choose the frequency of uptime reports: daily, weekly, or monthly.
-
Enter an email address where these reports will be sent.
-
Click “Save” to apply your settings.